 01 / AI SOLUTIONS
AI Security & Surveillance
Protect your people and property.
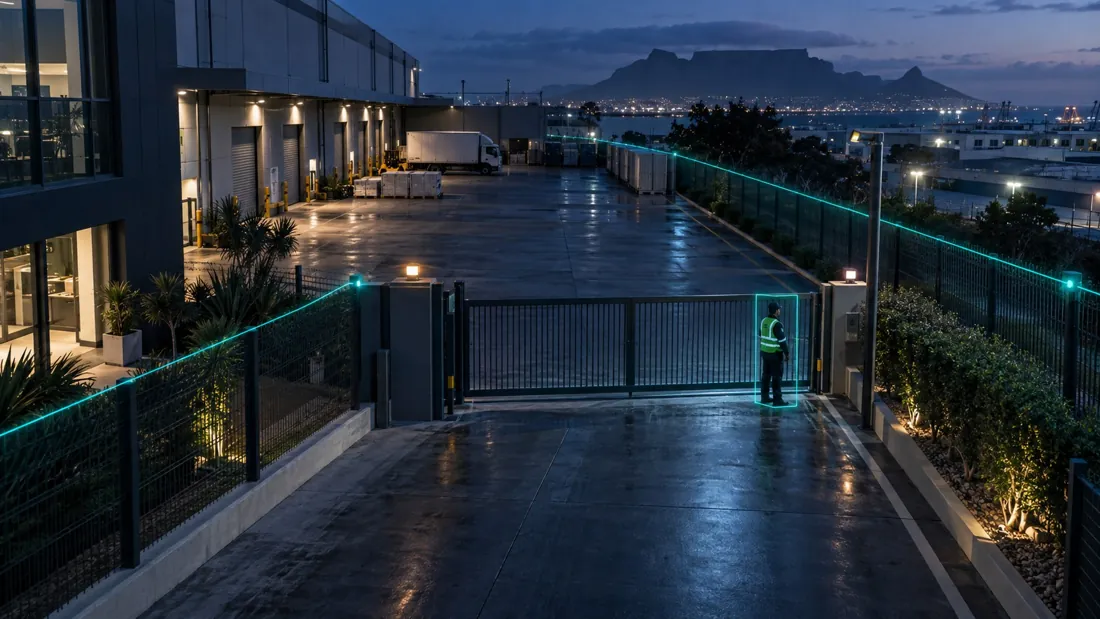
Flag restricted-area activity, review the footage and follow an agreed response plan.
Explore solutionProtect your sites. Understand your customers. Improve your operations. AI Monitor turns compatible CCTV into insight your team can act on.
Start with your existing cameras. Compatibility assessed before rollout.
 AI MONITOR / VIDEO INTELLIGENCE
Explore a solution below. Each explains what you can measure, how it works and what your team can do with the results.
Showing 6 solutions
01 / AI SOLUTIONSFlag restricted-area activity, review the footage and follow an agreed response plan.
Explore solution 02 / AI SOLUTIONS
Understand footfall, busy areas and waiting times to improve staffing and store layouts.
Explore solution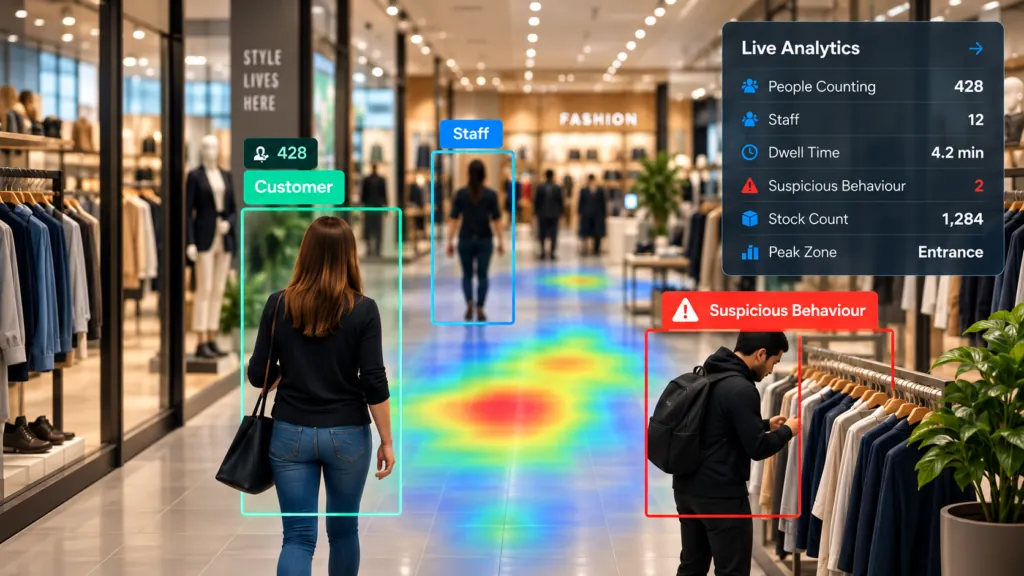 03 / AI SOLUTIONS
Bring possible shoplifting and unusual checkout activity to attention for human review.
Explore solution04 / AI SOLUTIONSReview visible delays, store standards and workflow gaps across your sites.
Explore solution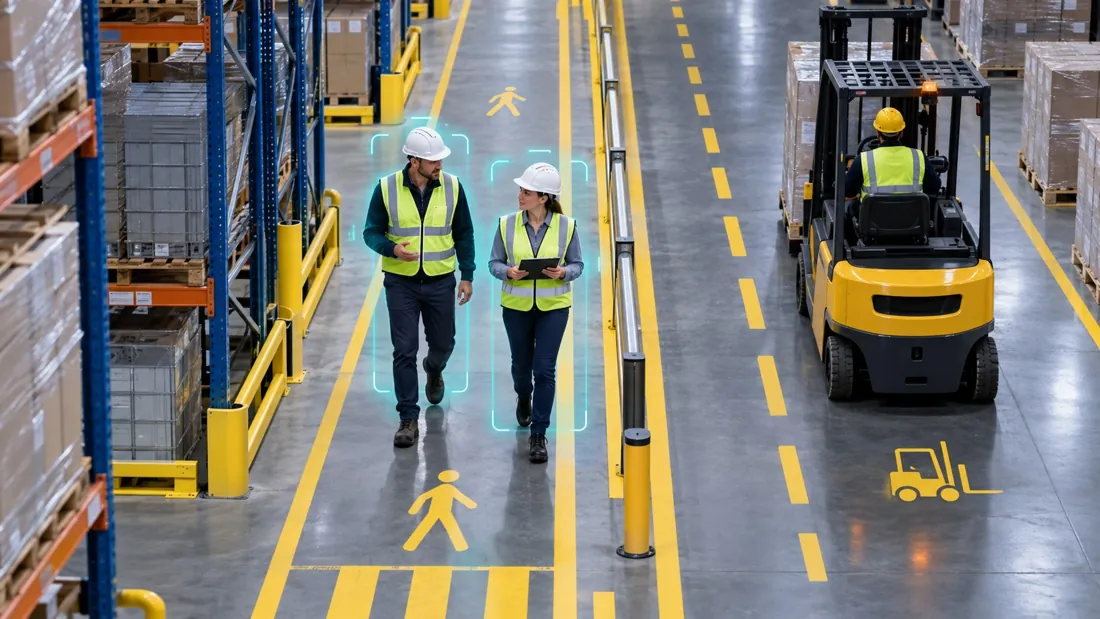 05 / AI SOLUTIONS
Bring visible hazards and safety-rule exceptions to the team responsible for acting.
Explore solution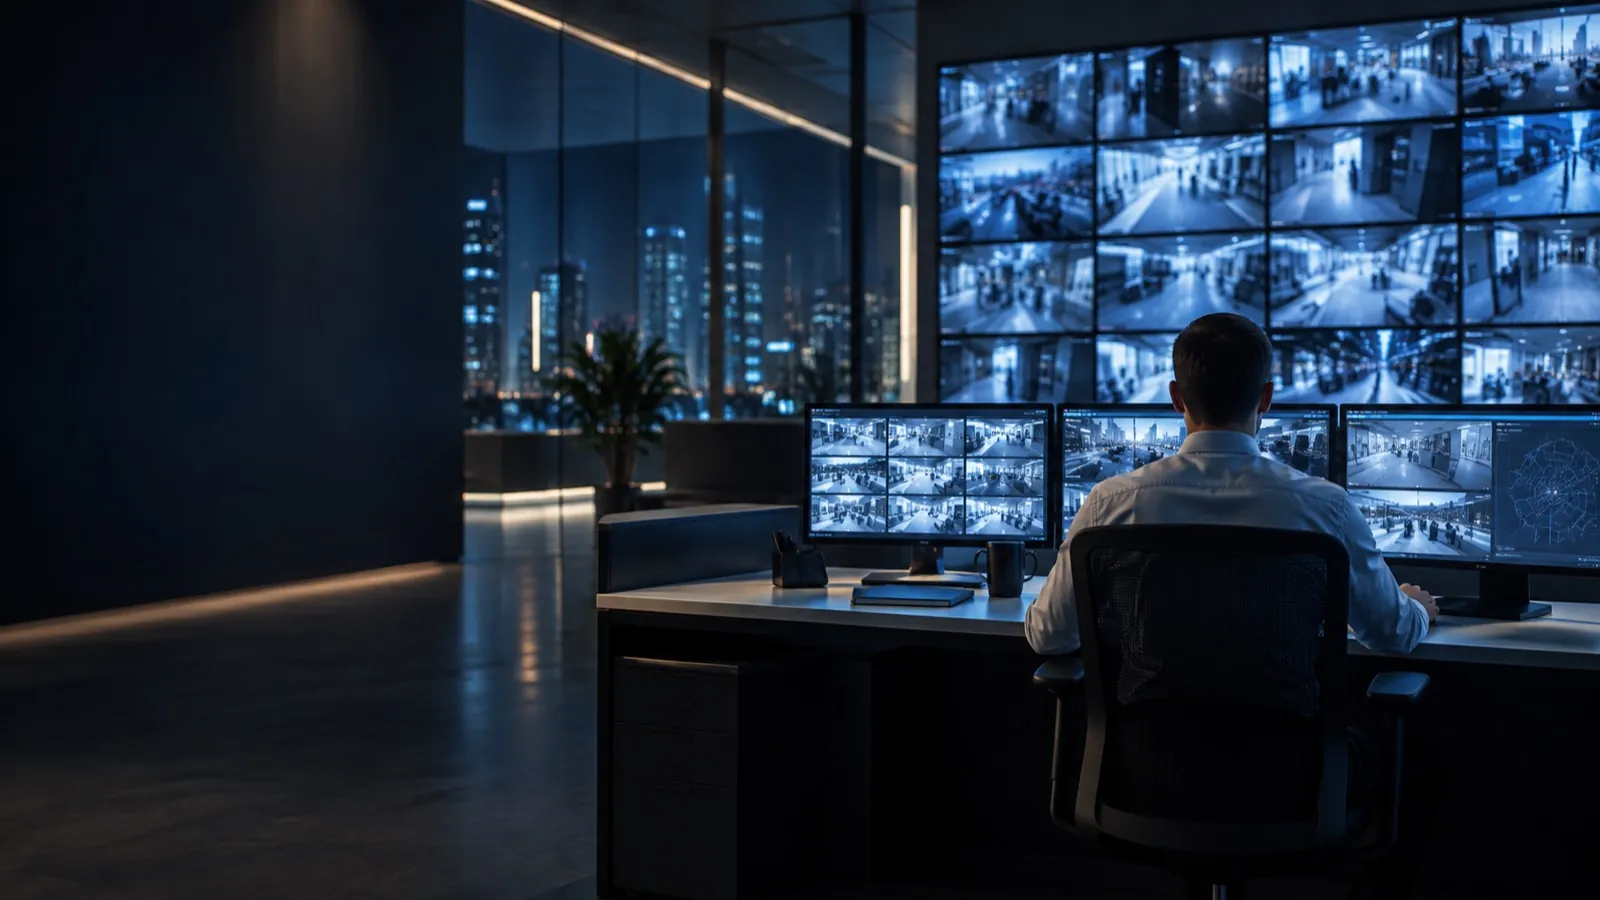 06 / AI SOLUTIONS
Bring cameras, searchable footage and investigation records into a connected workflow.
Explore solutionYour requirements may need a tailored combination. Discuss the site with AI Monitor, or view all solutions.
Start with one solution or combine several. We confirm camera suitability, selected features and any additional equipment before rollout.
No technical background needed. We connect the system around what your business needs to see.
We assess existing views, recording systems and connectivity for your chosen solution.
Selected applications turn visible activity into events, counts or searchable information.
Use the agreed alerts, footage and reports to investigate, respond or improve a process.
From the first assessment to everyday use, we help you build a solution around your business.
Identify which cameras can be reused and where equipment or views need attention.
Agree a focused pilot, useful measures and clear success criteria before a wider rollout.
Scope setup, training, reporting, support and optional control-room monitoring together.
We confirm compatibility, scope and costs before you commit to a rollout.
Potentially. We assess camera compatibility, image quality, coverage, recording access and connectivity before recommending equipment changes. Some views may need adjustment or additional hardware.
Your proposal separates the selected software, on-site equipment, implementation, integrations and any ongoing monitoring or reporting service. Features are not automatically included in a base camera licence.
A scoped pilot can be proposed around selected cameras and measurable objectives. The duration, equipment responsibilities, costs and success criteria are agreed before it starts.
The assessment should define authorised users, viewing and export rights, retention, notices and data-handling requirements. Cloud locations and any required data transfers are reviewed for the selected platform.
Tell us about your business and the problem you want to solve. We will guide you through a relevant demonstration and the next steps.